logstash: improving performance
Introduction
It has been a while since I’ve been using the elastic stack to collect and store logs from applications, services and devices that I need to monitor. Since Logstash is responsible for receiving, parsing and publishing those logs, it is extremely important that we guarantee that it has a good performance.
A lot of the performance problems that I’ve had were caused by configuration errors, implementation or incorrect usage of some filters, mainly the grok filter.
While the grok filter is extremely useful, it is a filter based on regular expressions and it needs to validate every expression, depending on how many events per second logstash is receiving, those validations could lead to a increase load on the CPU which could affect the entire monitoring process.
Grok or Dissect?
One simple way to improve the performance of a pipeline is to check if it is possible to use another filter instead of grok. A filter that I’ve been using as a replacement for grok is the dissect filter.
The main difference between grok and dissect is that dissect does not use regular expressions to parse the message, the fields are defined by its position, everything between a %{ and a } is seen as a field and everything else is seen as a delimiter, this makes dissect faster and lighter than grok.
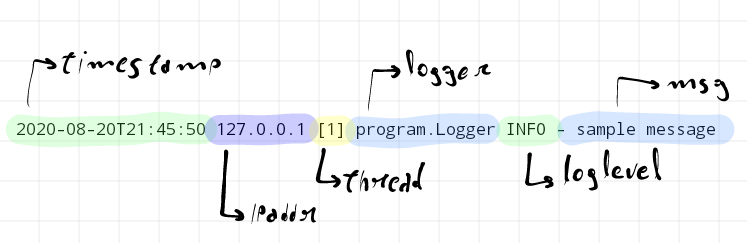
Considering the following example message:
2020-08-20T21:45:50 127.0.0.1 [1] program.Logger INFO - sample message
We can parse that message into the following fields:
timestamp,ipaddr,thread,logger,loglevel,msg
To parse that message with grok and dissect, we use the following configuration.
grok
grok {
    match => { "message" => "%{TIMESTAMP_ISO8601:timestamp} %{IP:ipaddr} \[%{INT:thread}\] %{DATA:logger} %{WORD:loglevel} - %{GREEDYDATA:msg}"}
}
dissect
dissect {
    mapping => {
        "message" => "%{timestamp} %{ipaddr} [%{thread}] %{logger} %{loglevel} - %{msg}"
    }
}
We can see that the structure is very similar, but with grok we need to specify the regex that we will use to validate the field, for example TIMESTAMP_ISO8601 for the field timestamp or IP for the field ipaddr, this is something that we do not need to do when using dissect, because it will use what is on that position as a value for the field, this is one of the reasons that will make us choose between the two of them.
If the collected messsages in a pipeline always have the same structure, or even if they have small variations, using dissect instead of grok is possible and it is an advantage since the parsing will be faster and will need less processing power.
But how faster and how less processing power it will need?
Grok vs Dissect
To compare the performance of the two filters, I’ve used a simple pipeline with the generator filter as an input and the stdout filter as an output, I’ve also used the grok and dissect filters show before on different runs.
input {
    generator {
        lines => ["2020-08-20T21:45:50 127.0.0.1 [1] program.Logger INFO - sample message"]
        count => 10000000
    }
}

filter {
    #
    # grok or dissect filter
    #
    if [sequence] != 0 and [sequence] != 9999999 {
         drop { }
     }
}
output {
    stdout { }
}
This pipeline basically generates 10 million messages, applies the specified filter, which could be grok or dissect, and use drop to drop every message except the first and the last one, which are show just to verify the beginning and ending of the processing.
This pipeline output is the following.
{
          "host" => "elk",
            "ipaddr" => "127.0.0.1",
       "message" => "2020-08-20T21:45:50 127.0.0.1 [1] program.Logger INFO - sample message",
      "sequence" => 0,
      "loglevel" => "INFO",
        "logger" => "program.Logger",
      "@version" => "1",
     "timestamp" => "2020-08-20T21:45:50",
           "msg" => "sample message",
        "thread" => "1",
    "@timestamp" => 2020-08-26T02:00:38.127Z
}
{
          "host" => "elk",
            "ipaddr" => "127.0.0.1",
       "message" => "2020-08-20T21:45:50 127.0.0.1 [1] program.Logger INFO - sample message",
      "sequence" => 9999999,
      "loglevel" => "INFO",
        "logger" => "program.Logger",
      "@version" => "1",
     "timestamp" => "2020-08-20T21:45:50",
           "msg" => "sample message",
        "thread" => "1",
    "@timestamp" => 2020-08-26T02:02:34.018Z
}
Since I was interested in comparing the CPU usage of the machine during the filters execution, I’ve used nmon running on background and harvesting metrics every 1 second during 5 minutes resulting in 300 measures, which is more than enough for this case.
For the execution of the pipeline I’ve used a VM with 4 vCPUs and 4 GB of RAM running CentOS 7.8 and Logstash on the version 7.9.
Each measure from nmon has the following format.
ZZZZ,T0010,00:16:49,21-AUG-2020
CPU001,T0010,50.5,2.0,0.0,46.5,1.0
CPU002,T0010,99.0,0.0,0.0,1.0,0.0
CPU003,T0010,97.0,1.0,0.0,1.0,1.0
CPU004,T0010,96.0,1.0,0.0,3.0,0.0
CPU_ALL,T0010,86.4,0.8,0.0,12.8,0.0,,4
MEM,T0010,3789.0,-0.0,-0.0,1024.0,2903.2,-0.0,-0.0,1024.0,-0.0,281.9,577.3,-1.0,2.0,0.0,181.5
VM,T0010,30,0,0,2384,12760,-1,0,0,0,0,27,0,0,2541,0,0,0,0,0,0,0,0,0,0,0,0,0,0,0,0,0,0,0,0,0,0,0
PROC,T0010,5,0,2524.7,-1.0,-1.0,-1.0,1.0,-1.0,-1.0,-1.0
NET,T0010,2.6,0.1,2.8,0.1
NETPACKET,T0010,10.9,2.0,12.9,2.0
JFSFILE,T0010,59.0,0.0,0.5,59.0,24.3,4.5,4.5,4.5
DISKBUSY,T0010,0.0,0.0,0.0,0.0
DISKREAD,T0010,0.0,0.0,0.0,0.0
DISKWRITE,T0010,0.0,0.0,0.0,0.0
DISKXFER,T0010,0.0,0.0,0.0,0.0
DISKBSIZE,T0010,0.0,0.0,0.0,0.0
From all those lines, just the line with CPU_ALL matters, more specifically the third column, which has the average usage percent of all CPUs at the time of the harvesting.
After some data manipulation of the harvested data during the execution of the pipeline with grok and after that, with dissect, we can visualize and compare the CPU usage and the execution time.
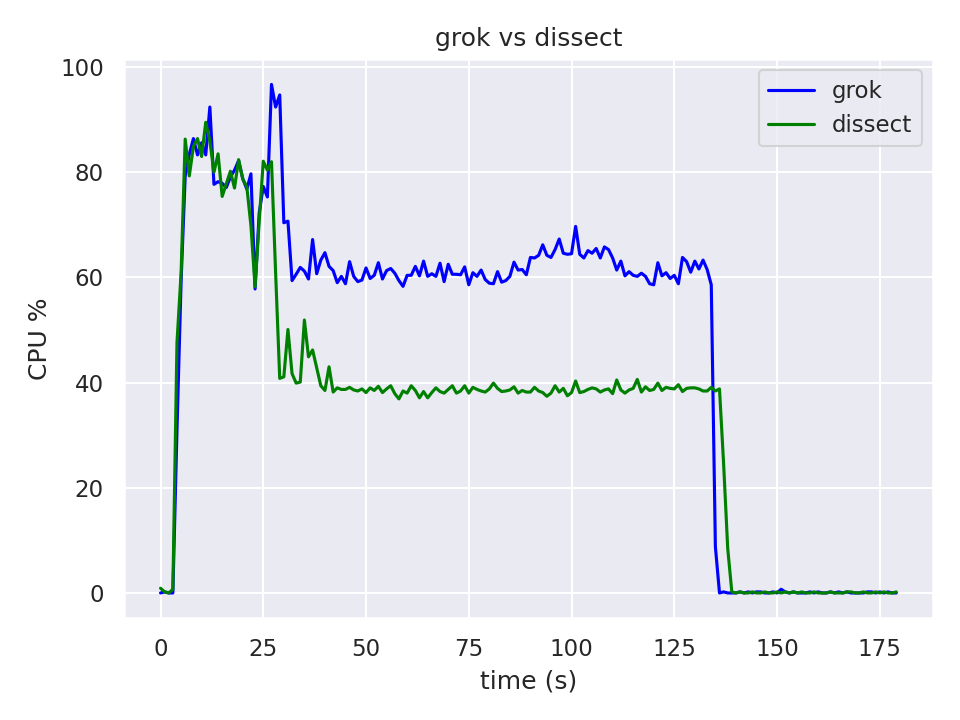
The initial usage spike that we see in the graphic is caused by initialization of Logstash, the folowing plateau corresponds to the usage during the processing of the messages.
Looking at the graphic we can see that the time to process the 10 million messages is basically the same for both filters tested in this specific use case, but we have a big difference in the cpu usage. We have an Average CPU Usage of 40% when using the dissect filter in comparison with an Average CPU Usage of more than 60% when using grok.
Conclusion and Links
Depending on the number of pipelines and events per second of each one of those pipelines, dedicating time to study if it is possible to replace grok by dissect is something that could lead to a huge improvement in the ingestion and analysis of data, besides that, it could also leads to costs cuts when you have your infrastructutre on the cloud since it will make possible to use smaller instances, as also less consumption of cpu credits on some cases.
On the cases where the logs have always the same structure, as web server logs, applicaton logs, firewalls and routers, or when you have control on the format that the logs will use, the dissect filter is the best choice when using Logstash to collect and parse those logs.
Links
dissect: official documentationgrok: official documentation